檔案:63 years of climate change by NASA.gif

出自 地方創生種籽宜蘭營
前往: 導覽搜尋
63_years_of_climate_change_by_NASA.gif(640 × 360 像素,檔案大小:2.55 MB,MIME 類型:image/gif、循環、24 畫格、2.4秒)

此檔案來自 維基共享資源 且可能被其他專案所使用。 下方顯示此檔案於 檔案描述頁面 的描述內容。

摘要

描述
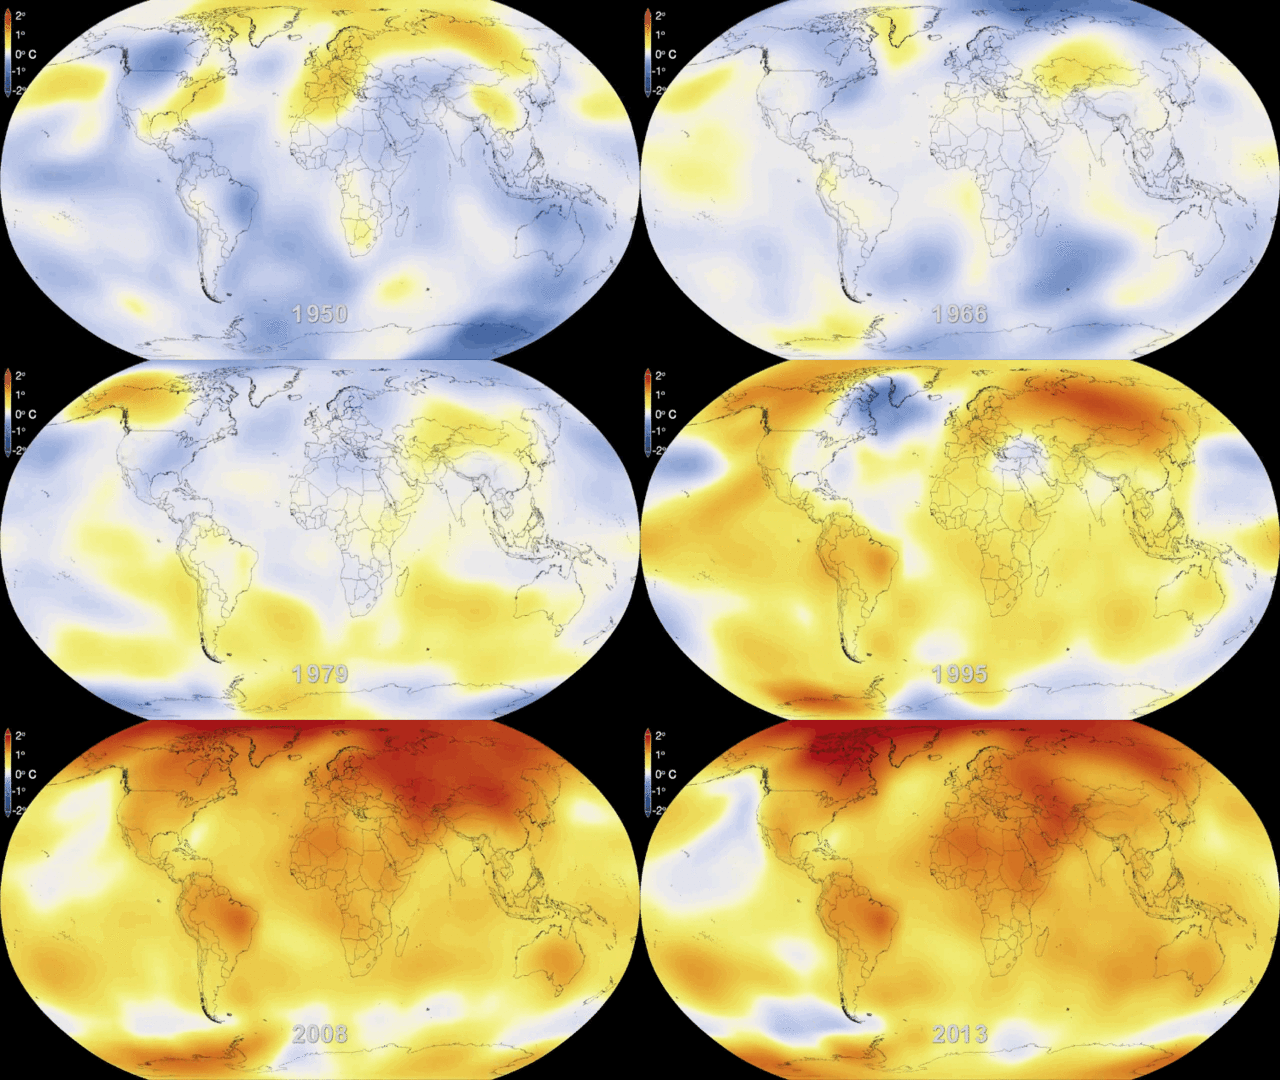
English: This visualization shows how global temperatures have risen from 1950 through the end of 2013.
NASA scientists say 2013 tied for the seventh warmest of any year since 1880, continuing a long-term trend of rising global temperatures. With the exception of 1998, the 10 warmest years in the 133-year record all have occurred since 2000, with 2010 and 2005 ranking as the hottest years on record.

NASA's Goddard Institute for Space Studies (GISS) in New York, which analyzes global surface temperatures on an ongoing basis, released an updated report Tuesday, Jan. 21, on temperatures around the globe in 2013. The comparison shows how Earth continues to experience warmer temperatures than several decades ago.

The visualization shows a running five-year average global temperature, as compared to a baseline average global temperature from 1951-1980.

日期
來源 http://svs.gsfc.nasa.gov/vis/a000000/a004100/a004135/
https://www.youtube.com/watch?v=gaJJtS_WDmI en:YouTube
作者 NASA
其他版本

授權條款

Public domain 本作品由NASA創作,屬於公有領域。根據NASA的版權政策:“NASA的創作除非另有聲明否則不受版權保護。”(參見:Template:PD-USGov/zhNASA版權政策JPL圖像使用政策
警告:

說明

添加單行說明來描述出檔案所代表的內容
This visualization shows how global temperatures have risen from 1950 through the end of 2013.

在此檔案描寫的項目

描繪內容

ac4829bc50befca1cd34fdc80e8314962b7f3ebe

斷定方法:​SHA-1 中文 (已轉換拼寫)

2,670,387 位元組

2.4 秒鐘

360 像素

640 像素

檔案歷史

點選日期/時間以檢視該時間的檔案版本。

日期/時間縮圖尺寸用戶備註
目前2014年1月29日 (三) 18:13於 2014年1月29日 (三) 18:13 版本的縮圖640 × 360(2.55 MB)CyberXRefUser created page with UploadWizard